Visualize data
Build dashboards and monitoring views for your captured data. Visualization helps you spot trends, detect anomalies, and monitor machine health.
Viam has two built-in options in the Viam app, plus external tools that connect to your data directly:
| Approach | Best for | Where |
|---|---|---|
| Data dashboards | Fleet-wide charts with windowing and aggregation, built into the Viam app | Data dashboards |
| Teleop workspaces | Live camera feeds, sensor readings, and controls for one machine | Teleop workspaces |
| Grafana | Rich dashboards, alerting, team-shared views | This page |
| Other third-party tools (Tableau, Looker Studio) | BI reporting, executive dashboards | This page |
| Custom with Viam SDKs (Python/Go + matplotlib or similar) | Custom reports, embedded charts, notebooks | This page |
Start with the built-in options. This page covers the other three, for when you need to work with your data outside the Viam app.
Viam stores captured data in a MongoDB Atlas Data Federation instance. This means that you can use any tool that can connect to MongoDB to access your data. External tools like Grafana connect to that data store. They can query data across machines and organizations, apply complex transformations, set up alerts, and share dashboards with team members who do not have Viam app access.
Custom visualization with Viam SDKs gives you complete control. You write code that queries data through the Viam SDK and renders it however you want – matplotlib charts, Plotly dashboards, HTML reports, or any other format.
Configure database access for third-party tools
To connect external visualization tools (Grafana, Tableau, Looker Studio, or any MongoDB-compatible client), you first need to set up database credentials using the Viam CLI.
Install the Viam CLI if you have not already:
To download the Viam CLI on a macOS computer, install brew and run the following commands:
brew trust viamrobotics/brews
brew tap viamrobotics/brews
brew install viam
On Debian-based distributions (Debian, Ubuntu, Raspberry Pi OS 64-bit), install the Viam CLI from Viam’s apt repository so apt upgrade keeps it up to date:
curl -fsSL https://us-apt.pkg.dev/doc/repo-signing-key.gpg | sudo gpg --dearmor -o /usr/share/keyrings/viam.gpg
echo "deb [signed-by=/usr/share/keyrings/viam.gpg] https://us-apt.pkg.dev/projects/static-file-server-310021 viam main" | sudo tee /etc/apt/sources.list.d/viam.list
sudo apt update && sudo apt install viam-cli
The package is named viam-cli; the installed command is viam (a viam-cli alias also works).
On other distributions, download the binary directly:
sudo curl --compressed -o /usr/local/bin/viam https://storage.googleapis.com/packages.viam.com/apps/viam-cli/viam-cli-stable-linux-arm64
sudo chmod a+rx /usr/local/bin/viam
On Debian-based distributions (Debian, Ubuntu), install the Viam CLI from Viam’s apt repository so apt upgrade keeps it up to date:
curl -fsSL https://us-apt.pkg.dev/doc/repo-signing-key.gpg | sudo gpg --dearmor -o /usr/share/keyrings/viam.gpg
echo "deb [signed-by=/usr/share/keyrings/viam.gpg] https://us-apt.pkg.dev/projects/static-file-server-310021 viam main" | sudo tee /etc/apt/sources.list.d/viam.list
sudo apt update && sudo apt install viam-cli
The package is named viam-cli; the installed command is viam (a viam-cli alias also works).
On other distributions, download the binary directly:
sudo curl --compressed -o /usr/local/bin/viam https://storage.googleapis.com/packages.viam.com/apps/viam-cli/viam-cli-stable-linux-amd64
sudo chmod a+rx /usr/local/bin/viam
Download the installer and run it.
The installer installs viam.exe for your user account and adds its folder to your user PATH, so you can run viam from any new Command Prompt or PowerShell window.
To upgrade, run viam update.
Alternatively, download the binary and run it directly.
If you have Go installed, you can build the Viam CLI from source. Clone the repository and build it with make:
git clone --depth 1 https://github.com/viamrobotics/rdk.git
cd rdk
make cli
sudo cp "bin/$(go env GOOS)-$(go env GOARCH)/viam-cli" /usr/local/bin/viam
To confirm viam is installed and ready to use, run viam version from your terminal.
Why not `go install`?
The RDK module replaces one of its dependencies, and Go refuses go install <package>@<version> for a module carrying replace directives.
For more information see install the Viam CLI.
Authenticate with the CLI
Authenticate using a personal access token:
viam login
For alternative authentication methods, see Authenticate.
Find your organization ID
The following steps require your organization ID. To find, it use the following command:
viam organizations list
Configure a new database user
Configure a new database user. The database user will be able to connect to your data, which is stored in a MongoDB Atlas Data Federation instance.
Warning
The command will create a user with your organization ID as the username. If you or someone else in your organization have already created this user, the following steps update the password for that user instead. Dashboards or other integrations relying on this password will then need to be updated.
Provide your organization’s org-id from step 2, and a password for your database user.
Your password must be at least 8 characters long with 1 uppercase, and 1 numeric character.
viam data database configure --org-id=<YOUR-ORGANIZATION-ID> --password=<NEW-DBUSER-PASSWORD>
Determine the connection URI
Determine the connection URI (also known as a connection string) for your organization’s MongoDB Atlas Data Federation instance by running the following command with the organization’s org-id from step 2:
viam data database hostname --org-id=abcd1e2f-a1b2-3c45-de6f-ab123456c123

MongoDB Atlas Data Federation instance hostname: data-federation-abcd1e2f-a1b2-3c45-de6f-ab123456c123-0z9yx.a.query.mongodb.net
MongoDB Atlas Data Federation instance connection URI: mongodb://db-user-abcd1e2f-a1b2-3c45-de6f-ab123456c123:YOUR-PASSWORD-HERE@data-federation-abcd1e2f-a1b2-3c45-de6f-ab123456c123-0z9yx.a.query.mongodb.net/?ssl=true&authSource=admin
This command returns the:
hostname: the MongoDB Atlas Data Federation instance hostname
connection URI: the MongoDB Atlas Data Federation instance connection uniform resource indicator. This is the connection URI to your organization’s MongoDB Atlas Data Federation instance, which is of the form:
mongodb://<USERNAME>:<YOUR-PASSWORD>@<HOSTNAME>/?ssl=true&authSource=admin
Most MQL-compatible database clients require the connection URI, along with your user credentials, to connect to this server.
Some MQL-compatible database client instead require a hostname and database name, along with your user credentials, to connect to this server.
For sensor data, this database name will be sensorData.
You now have three pieces of information needed by any external tool:
- Hostname (from the
hostnamecommand) - Username:
db-user-<YOUR-ORG-ID> - Password (from the
configurecommand)
Connect Grafana to your data
Grafana is a popular open-source visualization tool that works well with Viam’s MongoDB-backed data store.
Install Grafana
If you do not already have a Grafana instance:
- Grafana Cloud: Sign up at grafana.com. The free tier is sufficient for testing.
- Local Grafana Enterprise: Install following the official Grafana installation guide.
Install the MongoDB data source plugin
Open your Grafana web UI.
Navigate to Connections > Add new connection.
Search for MongoDB.
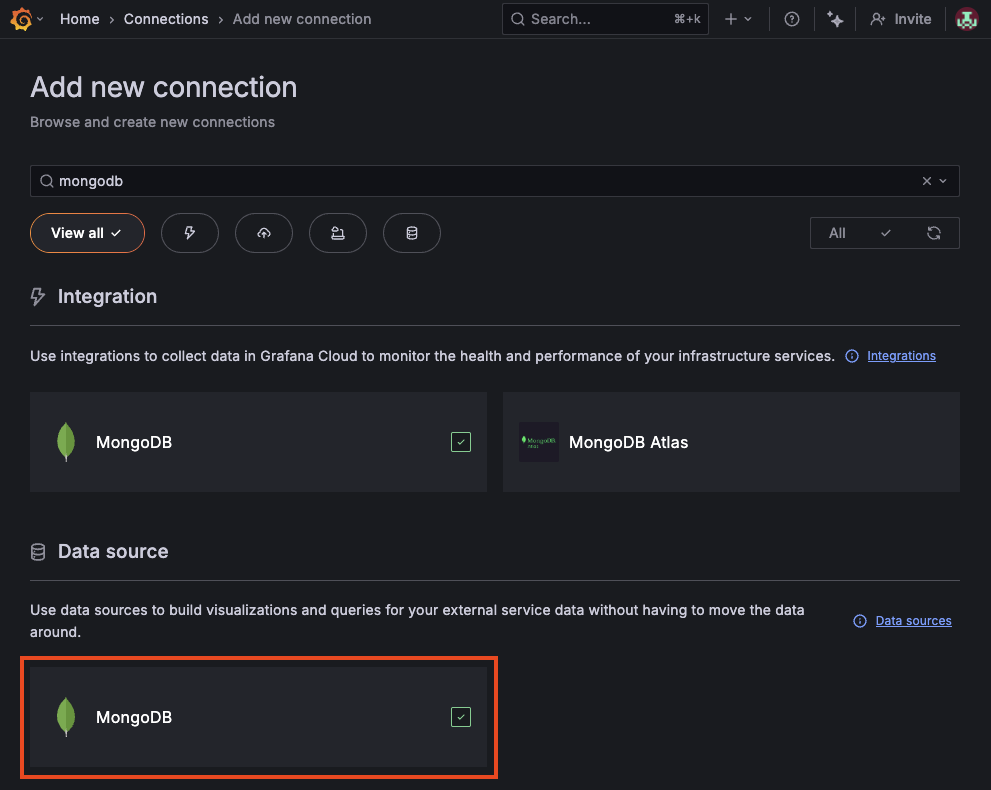
Install the Grafana MongoDB data source plugin.

Important
Install the MongoDB data source, not the MongoDB integration. They are different plugins. The data source is what allows you to query MongoDB from Grafana dashboards.
If the MongoDB data source does not appear in the plugin catalog, install it from the Grafana MongoDB data source plugin page using the installation instructions for your Grafana deployment type.
Configure the data connection
After installing the plugin, go to its configuration page and click Add new data source.
Fill in the following fields:
Connection string:
mongodb://<HOSTNAME>/sensorData?directConnection=true&authSource=admin&tls=trueReplace
<HOSTNAME>with the hostname from Configure database access.User:
db-user-<YOUR-ORG-ID>Password: The password you set with the
viam data database configurecommand.
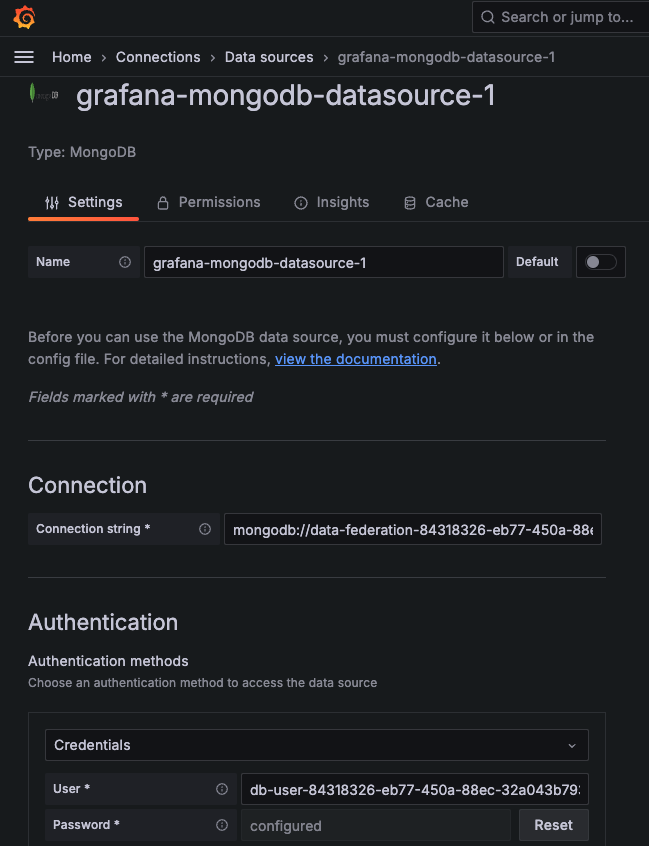
For more information on the Grafana MongoDB plugin, see Configure the MongoDB data source.
Click Save & test. Grafana should confirm the connection is working.

Build a Grafana dashboard
Click Dashboards in the left sidebar, then New > New dashboard.
Click Add visualization.
Select the MongoDB data source you just configured.
In the query editor, enter an MQL query. For example, to plot sensor readings over time:
sensorData.readings.aggregate([
  {
    $match: {
      component_name: "sensor-1",
      time_received: { $gte: ISODate(${__from}) }
    }
  },
  { $sort: { time_received: 1 } },
  { $limit: 1000 }
])
Replace
sensor-1with the name of your component.The
${__from}and${__to}variables are Grafana global variables populated by the time range selector at the top of your dashboard. When you change the time range, the query updates automatically.Click Run query to see results.
Choose a visualization type (Time series, Gauge, Stat, Table, etc.) from the panel options on the right.
Click Apply to add the panel to your dashboard.
Useful query patterns for Grafana
Average sensor value per hour:
sensorData.readings.aggregate([
  {
    $match: {
      component_name: "my-sensor",
      time_received: { $gte: ISODate(${__from}), $lte: ISODate(${__to}) }
    }
  },
  {
    $group: {
      _id: {
        $dateToString: { format: "%Y-%m-%d %H:00", date: "$time_received" }
      },
      avg_value: { $avg: "$data.readings.temperature" },
      count: { $sum: 1 }
    }
  },
  { $sort: { _id: 1 } }
])
Count of readings per component:
sensorData.readings.aggregate([
  {
    $match: {
      time_received: { $gte: ISODate(${__from}) }
    }
  },
  {
    $group: {
      _id: "$component_name",
      count: { $sum: 1 }
    }
  },
  { $sort: { count: -1 } }
])
Connect other third-party tools
The database credentials from Configure database access work with any tool that supports MongoDB Atlas Data Federation as a data store. The general pattern is the same:
Install the tool’s MongoDB connector or driver. For example:
- Tableau requires the Atlas SQL JDBC Driver and the Tableau Connector.
- Google Looker Studio supports MongoDB connections natively through community connectors.
Configure the connection using one of these formats:
Connection URI format (most tools):
mongodb://db-user-<YOUR-ORG-ID>:<YOUR-PASSWORD>@<HOSTNAME>/sensorData?tls=true&authSource=adminHostname + credentials format (tools that ask for fields separately):
- Hostname: the value from
viam data database hostname - Database name:
sensorData - Username:
db-user-<YOUR-ORG-ID> - Password: from the
configurecommand
- Hostname: the value from
Build dashboards using the tool’s native interface.
Tip
Before building dashboards, use MongoDB Compass to browse your data and explore its structure. Compass’s Schema Analyzer shows you the fields, types, and value distributions in your data, which helps you write accurate queries in your visualization tool.
Custom visualizations with Viam SDKs
When you need full control over visualization – embedding charts in your own application, generating reports, or running in a Jupyter notebook – use the Viam SDK to query data and a plotting library to render it.
Install the Viam Python SDK in a virtual environment by following Install the Python SDK. Then install matplotlib:
pip3 install matplotlib
Save this as visualize_data.py:
import asyncio
from datetime import datetime, timedelta, timezone

import matplotlib.pyplot as plt
import matplotlib.dates as mdates
from viam.rpc.dial import DialOptions, Credentials
from viam.app.viam_client import ViamClient


API_KEY = "YOUR-API-KEY"
API_KEY_ID = "YOUR-API-KEY-ID"
ORG_ID = "YOUR-ORGANIZATION-ID"


async def connect() -> ViamClient:
    dial_options = DialOptions(
        credentials=Credentials(
            type="api-key",
            payload=API_KEY,
        ),
        auth_entity=API_KEY_ID,
    )
    return await ViamClient.create_from_dial_options(dial_options)


async def main():
    viam_client = await connect()
    data_client = viam_client.data_client

    # Query the last 24 hours of sensor data.
    data = await data_client.tabular_data_by_mql(
        organization_id=ORG_ID,
        query=[
            {"$match": {
                "component_name": "my-sensor",
                "time_received": {
                    "$gte": {"$date": (
                        datetime.now(timezone.utc) - timedelta(hours=24)
                    ).isoformat()}
                },
            }},
            {"$sort": {"time_received": 1}},
            {"$limit": 1000},
            {"$project": {
                "time_received": 1,
                "temperature": "$data.readings.temperature",
                "_id": 0,
            }},
        ],
    )

    if not data:
        print("No data returned. Check your component name and time range.")
        viam_client.close()
        return

    # Extract timestamps and values.
    timestamps = [entry["time_received"] for entry in data]
    temperatures = [entry["temperature"] for entry in data]

    # Plot the data.
    fig, ax = plt.subplots(figsize=(12, 5))
    ax.plot(timestamps, temperatures, linewidth=1.5, color="#3b82f6")
    ax.set_xlabel("Time")
    ax.set_ylabel("Temperature")
    ax.set_title("Sensor Temperature - Last 24 Hours")
    ax.xaxis.set_major_formatter(mdates.DateFormatter("%H:%M"))
    ax.grid(True, alpha=0.3)
    fig.autofmt_xdate()
    plt.tight_layout()

    # Save to file and show.
    plt.savefig("temperature_chart.png", dpi=150)
    print("Chart saved to temperature_chart.png")
    plt.show()

    viam_client.close()


if __name__ == "__main__":
    asyncio.run(main())
To get your credentials:
- Go to your machine’s page in the Viam app.
- Click the CONNECT tab.
- Select API keys.
- Copy the API key and API key ID.
Find your organization ID in the Viam app by clicking your organization name and selecting Settings.
Replace my-sensor with your component name. Then run:
python visualize_data.py
This produces a time-series chart of temperature readings and saves it as a PNG file.
Initialize a Go module and install dependencies:
mkdir visualize-data && cd visualize-data
go mod init visualize-data
go get go.viam.com/rdk
go get gonum.org/v1/plot
Save this as main.go:
package main

import (
    "context"
    "fmt"
    "time"

    "go.viam.com/rdk/app"
    "go.viam.com/rdk/logging"
    "gonum.org/v1/plot"
    "gonum.org/v1/plot/plotter"
    "gonum.org/v1/plot/vg"
)

func main() {
    apiKey := "YOUR-API-KEY"
    apiKeyID := "YOUR-API-KEY-ID"
    orgID := "YOUR-ORGANIZATION-ID"

    ctx := context.Background()
    logger := logging.NewDebugLogger("visualize-data")

    viamClient, err := app.CreateViamClientWithAPIKey(
        ctx, app.Options{}, apiKey, apiKeyID, logger)
    if err != nil {
        logger.Fatal(err)
    }
    defer viamClient.Close()

    dataClient := viamClient.DataClient()

    // Query the last 24 hours of sensor data.
    cutoff := time.Now().UTC().Add(-24 * time.Hour)
    mqlStages := []map[string]interface{}{
        {"$match": map[string]interface{}{
            "component_name": "my-sensor",
            "time_received": map[string]interface{}{
                "$gte": map[string]interface{}{
                    "$date": cutoff.Format(time.RFC3339),
                },
            },
        }},
        {"$sort": map[string]interface{}{"time_received": 1}},
        {"$limit": 1000},
        {"$project": map[string]interface{}{
            "time_received": 1,
            "temperature":   "$data.readings.temperature",
            "_id":           0,
        }},
    }

    results, err := dataClient.TabularDataByMQL(ctx, orgID, mqlStages, nil)
    if err != nil {
        logger.Fatal(err)
    }

    if len(results) == 0 {
        fmt.Println("No data returned. Check your component name and time range.")
        return
    }

    // Build plot data points.
    pts := make(plotter.XYs, len(results))
    for i, entry := range results {
        // Extract timestamp as float (seconds since epoch).
        if t, ok := entry["time_received"].(time.Time); ok {
            pts[i].X = float64(t.Unix())
        }
        // Extract temperature value.
        if temp, ok := entry["temperature"].(float64); ok {
            pts[i].Y = temp
        }
    }

    // Create the plot.
    p := plot.New()
    p.Title.Text = "Sensor Temperature - Last 24 Hours"
    p.X.Label.Text = "Time"
    p.Y.Label.Text = "Temperature"

    line, err := plotter.NewLine(pts)
    if err != nil {
        logger.Fatal(err)
    }
    p.Add(line)

    // Save to file.
    if err := p.Save(10*vg.Inch, 4*vg.Inch, "temperature_chart.png"); err != nil {
        logger.Fatal(err)
    }
    fmt.Println("Chart saved to temperature_chart.png")
}
Replace the placeholder values and component name, then run:
go run main.go
Try It
Connect Grafana. Run the CLI commands to configure database access, set up the Grafana MongoDB data source, and run the example MQL query. Create a time-series panel and verify the chart updates when you change the time range selector.
Run the Python or Go script. Copy one of the programmatic examples, fill in your credentials, and run it. You should see a
temperature_chart.pngfile in your working directory.
Troubleshooting
What’s next
- Query Data – learn the full range of SQL and MQL queries you can use to extract insights from your data.
- Data pipelines – set up aggregated views and derived metrics to power your dashboards more efficiently.
- Filtered camera – reduce noise in your visualizations by filtering data before it leaves the machine.
Was this page helpful?
Glad to hear it! If you have any other feedback please let us know:
We're sorry about that. To help us improve, please tell us what we can do better:
Thank you!